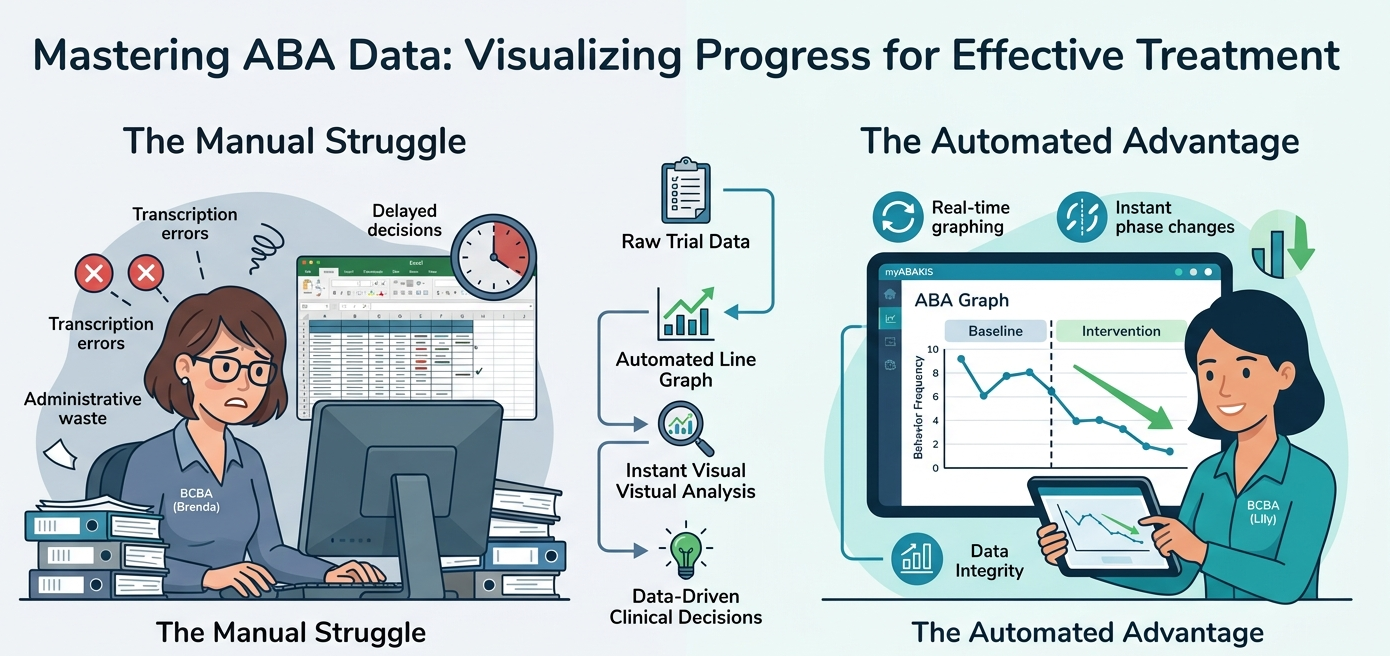
Graphing ABA data is the cornerstone of evidence-based Applied Behavior Analysis (ABA). Whether evaluating a skill acquisition program or analyzing a Behavior Intervention Plan (BIP), Board Certified Behavior Analysts (BCBAs) rely on visual data to identify trends, variability, and level changes in real time.
However, for many clinical directors and supervising analysts managing high caseloads, graphing ABA data remains one of the most time-consuming administrative bottlenecks. When therapists manually transcribe session notes from paper binders or attempt to build custom charts in generic spreadsheets, clinical decision-making stalls.
Modern practice management requires moving beyond clunky spreadsheet workarounds toward automated, real-time data visualization.
The Power of Visual Analysis in Behavioral Intervention
In behavior analysis, numerical tables rarely tell the full story. Systematic visual analysis allows clinical teams to evaluate treatment efficacy objectively and detect critical patterns immediately:
- Evaluating Baseline vs. Intervention: Comparing pre-treatment data points against intervention data provides clear empirical evidence of behavior change.
- Identifying Trend and Variability: Visualizing whether data points show an accelerating, decelerating, or zero-trend path prevents premature program changes or delayed adaptations.
- Minimizing Observer Drift and Bias: Standardized ABA progress monitoring graphs ensure every supervising BCBA, Registered Behavior Technician (RBT), and family member views the exact same clinical reality.
Key Elements for Graphing ABA Data in Clinics
To interpret behavioral progress accurately, every standard clinical chart must incorporate core graphic elements:
- The Equal-Interval Line Graph: The standard format for displaying continuous or discontinuous behavioral data across time (sessions, days, or trials).
- Phase Change Lines: Vertical lines that clearly demarcate adjustments in environmental conditions, baseline transitions, or intervention changes (e.g., introduction of a new prompt fading procedure).
- Condition Labels: Clear, brief descriptors above each phase change line that explain the specific intervention active during that observation block.
- Data Paths: Solid lines connecting successive data points within a condition, deliberately broken across a phase change line to maintain condition integrity.
The Administrative Cost of Manual Graphing
While visual analysis is non-negotiable, the manual mechanics of producing graphs create massive friction for growing clinics:
- Time Drain: Chasing paper session sheets and manually entering numbers into Excel or Google Sheets wastes billable clinical hours every week.
- Formatting Errors: A broken formula or misplaced axis in a generic spreadsheet can distort data paths, misrepresenting client outcomes during audits or parent reviews.
- Delayed Decision-Making: When graphs are updated only once a week—or right before a progress report deadline—therapists miss opportunities to fade prompts or address behavioral plateaus in real time.
Automate Your Graphing Workflow
Remove the frustration of manual data entry, complex software setups and automate clinical visualization by graphing ABA data instantly. Look for software specifically designed for scaling your clinic with simplicity.
- Instant Graph Generation: The moment an RBT logs trial data during direct therapy or Natural Environment Teaching (NET), our platform automatically updates client line graphs in real time.
- Automated Phase Changes: Insert a phase change line with a single click to document baseline transitions, prompt hierarchy adjustments, or medication updates cleanly.
- Crash-Resistant & Offline Ready: Data logged offline is saved securely on the device and syncs immediately once reconnected, ensuring zero data points disappear from your visual path.
- Parent-Friendly Reports: Export clear, professional visual graphs for parents and funding sources without spending hours reformatting charts.
Stop drowning in manual spreadsheets. Focus your time on clinical excellence and team leadership. Schedule an Audit Readiness Demo Today