

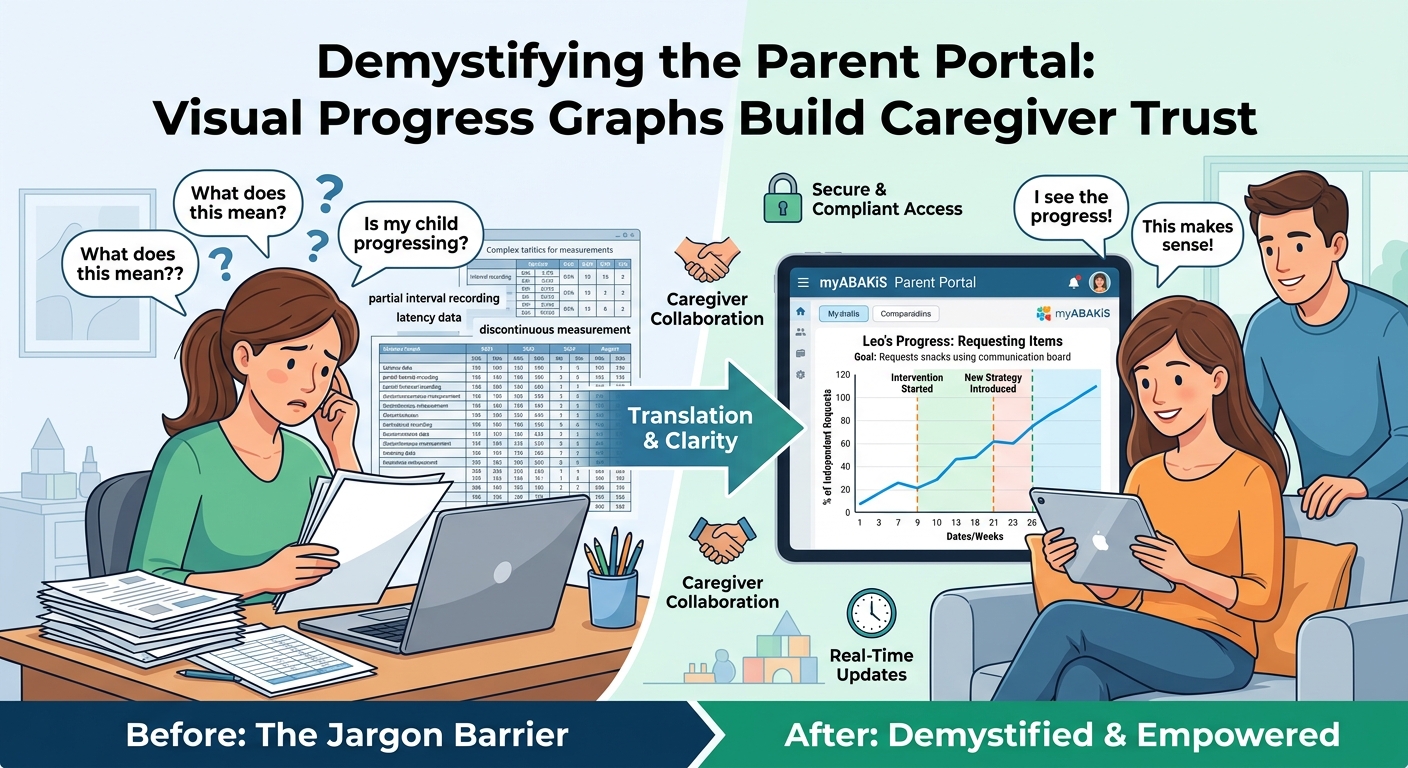
When a child begins Applied Behavior Analysis (ABA) therapy, caregivers invest immense hope, time, and emotional energy into the process. Yet, for many parents, a lack of proper ABA progress reporting feels like attempting to decipher a foreign language. Traditional progress updates often consist of brief verbal summaries at pick-up or dense tables of numbers delivered months later.
Effective ABA progress reporting bridges the gap between clinical data collection and caregiver empowerment. By translating raw behavior metrics into clear, visual progress graphs within a secure ABA parent communication portal, therapy practices can eliminate jargon, build deep trust with families, and foster true collaborative care.
Board Certified Behavior Analysts (BCBAs) and Registered Behavior Technicians (RBTs) rely on precise behavioral terminology to maintain treatment fidelity. However, sharing raw data without visual context often creates confusion and anxiety for parents.
Caregiver Communication Disconnect
- Terminology Confusion: Clinical terms like “discontinuous measurement,” “latency,” or “partial interval recording” intimidate parents who simply want to know if their child is making progress.
- Data Isolation: Dense spreadsheets and trial-by-trial counts make it difficult for families to see overarching growth over weeks or months.
- Lack of At-Home Alignment: Without real-time visibility into skill acquisition targets, parents struggle to reinforce therapy goals consistently at home.
- Compliance and Privacy Risks: Distributing unencrypted paper reports or insecure digital files breaches standards set by the Ontario IPC Guidelines on Safeguarding Personal Health Information.
Providing clear, visual ABA progress reporting through a dedicated platform resolves these barriers, making clinical progress accessible to families without compromising technical accuracy.
Visual data analysis is fundamental to behavior analytic practice. When shared with caregivers in a clean, visual format, graphs transform abstract numbers into clear stories of client achievement.
Elements of a Parent-Friendly Progress Graph
- 1. Clear Trend Lines: Simple line graphs instantly illustrate whether target skills are increasing or challenging behaviors are decreasing.
- 2. Contextual Phase Change Lines: Clear visual markers explain why a intervention changed (e.g., introducing a new prompt hierarchy or fading support).
- 3. Plain-Language Target Labels: Replacing technical acronyms with functional goal descriptions (e.g., “Requesting Snacks Using AAC” instead of “Mand Target 3B”).
Adhering to professional standards such as the BACB Ethics Code for Behavior Analysts requires practitioners to communicate progress in a way that is understandable and actionable for clients and guardians.
Implementing a transparent reporting system delivers operational and clinical benefits across the entire therapy team.
When parents can view real-time visual progress through an ABA parent communication portal, they feel included as active partners in their child’s therapy journey. Clear graphs give caregivers confidence that programs are evidence-based and effective.
Visual ABA progress reporting provide concrete anchor points during parent training sessions. BCBAs can demonstrate how consistency across home and clinic settings directly correlates with positive trend lines on the graph.
For clinic directors, standardizing progress graphing ensures compliance under CPBAO Practice Guidelines for Standardized Documentation. Automated progress tracking reduces administrative report-writing time for senior clinicians while maintaining meticulous audit readiness.
A parent communication portal bridges the gap between complex data collection and family collaboration, delivering an intuitive platform designed for therapy providers and parents.
By replacing intimidating data sheets with intuitive visual reporting, your clinic fosters strong caregiver relationships, streamlines administrative work, and keeps the focus where it belongs: on client outcomes.
Elevate your client reporting and build stronger partnerships with families. Request a Demo with My ABAKiS Today to see how transparent, visual graphing transforms caregiver communication
